


I remember sitting at my mother’s heavy oak desk in the late eighties, surrounded by the scent of old paper and ink, trying to make sense of why two people who seemed so perfect on paper felt so dissonant in person. I spent hours squinting at my mother’s worn paperbacks, trying to find a formula that would explain the friction, only to realize that most “compatibility” books are just selling a dream. They treat putting two charts side by side like a magic trick where you plug in two sets of data and out pops a marriage certificate. It’s a nonsense approach that ignores the actual mechanics of how two distinct planetary maps interact, and frankly, it’s insulting to the math.
If you find yourself struggling to keep the planetary degrees straight while trying to map out these overlapping connections, I often find it helpful to step away from the hand-drawn sketches and use a dedicated calculation engine. For instance, if you are trying to look at generational patterns or the specific dynamics of family roles, you can compare a parent and child chart to see how those mathematical intersections actually land on the houses. It doesn’t replace the work of interpreting the geometry, but it does ensure that your starting data is accurate before you begin the much harder task of finding the meaning.
I’m not here to tell you that the stars have pre-ordained your relationship, nor will I promise that a specific aspect means you are soulmates. Instead, I want to show you the actual process of putting two charts side by side to see where the mathematical overlaps occur and, more importantly, where they don’t. I will walk you through the technicalities of synastry and composite calculations, showing you exactly what the data reveals and where the limits of the technique lie.
Beyond the Single View the Logic of Putting Two Charts Side by Side

When I look at a single birth chart, I am looking at a closed system—a snapshot of a specific moment in time. But when I begin visualizing comparative data between two people, I am no longer looking at a snapshot; I am looking for the friction or the resonance between two different sets of mechanics. I don’t do this to find “soulmates,” which is a term that carries far too much unearned weight. Instead, I do it to see how one person’s planetary placements might interact with the mathematical backdrop of another’s.
The logic isn’t about finding a perfect match, but about observing how different cycles overlap. In my library days, we used comparative indexes to see how different texts referenced the same historical events; I approach a reading similarly. By employing specific side-by-side chart layout techniques, I can see if one person’s Saturn return is occurring at the same time the other person is experiencing a major Jupiter transit. It isn’t magic; it is simply mathematical synchronicity. I want to see where the gears mesh and where they grind, without pretending the stars are pulling the levers.
The Math of Comparison Mastering Side by Side Chart Layout Techniques
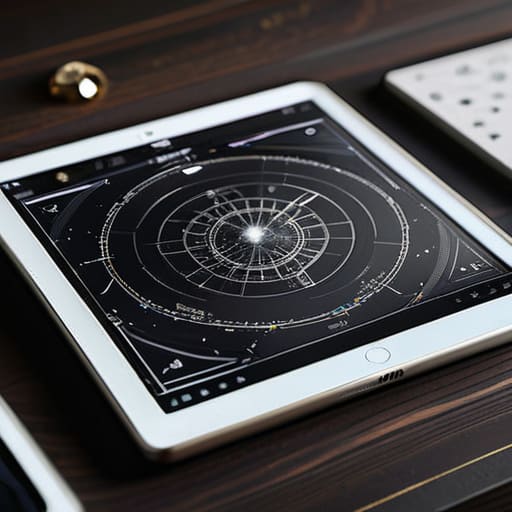
When I’m looking at two people’s charts, I don’t just glance at them; I look for the mathematical friction between them. To do this properly, you have to move past the aesthetic and focus on aligning multiple graphs so that the aspect patterns actually speak to one another. If you are using software, the temptation is to overlay everything into a single, messy composite. I’ve found that is often a mistake. It creates a visual noise that obscures the individual’s integrity. Instead, I prefer a clean, split-screen approach where the planetary positions are scaled identically.
I treat this much like the dashboard design principles I used to see in technical manuals during my library days: clarity must precede insight. You aren’t looking for a “soulmate score”; you are looking for how one person’s Saturn placement interacts with another’s natal Sun. By utilizing specific side-by-side chart layout techniques, such as keeping the zodiacal wheel orientation identical for both subjects, you can visually trace the lines of tension or support. It isn’t about forcing a connection—it’s about seeing if the geometry allows for one.
Dual Axis vs Multiple Charts Choosing Your Analytical Framework

When you decide to move beyond a single person’s wheel, you face a structural choice: do you try to merge the information into one complex image, or do you keep the individual charts separate? In my experience, the temptation is to use a single wheel with two sets of overlays, but that often results in a visual mess that even a librarian would struggle to index. This is the core of the dual axis vs multiple charts debate. While a single, overlaid chart can show immediate intersections, it frequently obscures the individual dignity of each person’s placements.
I generally find that aligning multiple graphs—placing two distinct, clean wheels next to each other—is the more honest way to work. When you are visualizing comparative data, the goal isn’t to force a synthesis that isn’t there; it is to see how the two distinct geometries sit in relation to one another. If you try to cram every planet from both charts into one circle, you aren’t reading the stars; you’re just squinting at a knot of lines. Keep them separate, keep them clear, and let the comparison happen in your mind rather than in a cluttered graphic.
The Mechanics of Alignment Precision in Aligning Multiple Graphs
When I sit down at my desk to compare two lives, I find that the biggest mistake people make is trying to force a visual harmony that isn’t actually there. If you are aligning multiple graphs to see how two people’s transits interact, you cannot simply slap them onto a page and hope for the best. You have to ensure the scales are identical. If one chart uses a thirty-degree zodiacal scale and the other is compressed or shifted, you aren’t seeing a relationship; you are seeing a distortion. I always check my math twice—once for the planetary longitudes and once for the house cusps—because a slight misalignment in the grid makes the entire comparison useless.
Precision is the only thing that separates a serious study from a parlor trick. When you are visualizing comparative data, the eye naturally seeks out patterns, but those patterns are often illusions created by poor layout. I prefer to keep the axes strictly synchronized. If the degree markers don’t line up perfectly on the vertical plane, your brain will try to invent connections between aspects that don’t actually exist. I’ll show you how to lock those coordinates, but you must be disciplined enough to trust the numbers rather than the visual “vibe.”
Avoiding False Narratives When Comparing Data Visualizations
The danger of side-by-side chart layout techniques isn’t in the math; it’s in the human tendency to see patterns where none exist. When I look at two natal charts, my brain naturally wants to draw a line between a Mars conjunction in one and a Saturn square in the other, as if the universe is whispering a secret. But just because two points sit near each other on a page doesn’t mean they are functionally linked. We often fall into the trap of forcing a connection simply because the visual proximity makes it look tidy.
When you are visualizing comparative data, you must be disciplined enough to acknowledge the “noise.” If you are choosing between a dual axis vs multiple charts approach, remember that a single axis can sometimes create a false sense of scale, making a minor planetary aspect look as significant as a major transit. I always tell my students that the goal isn’t to find a story that fits; it is to respect the integrity of the individual data points. If the alignment isn’t mathematically significant, don’t invent a meaning just to satisfy the desire for a cohesive narrative.
Structural Integrity Applying Essential Dashboard Design Principles
When I’m setting up a workspace to look at two lives at once, I find myself leaning on the same logic I used back in the library: organization isn’t about decoration; it’s about reducing cognitive load. If you are visualizing comparative data, you shouldn’t have to hunt for the legend or squint to see if the scale on the left matches the scale on the right. I treat a comparison like a well-organized card index. Every element—the house cusps, the planetary aspects, the degree markers—needs a consistent anchor point. If the visual weight of one chart is heavier because of a dense cluster of planets, it can trick your eye into thinking that person’s life is inherently “louder” than the other’s, which is a mechanical error, not an astrological one.
I always apply basic dashboard design principles to ensure the layout serves the data rather than obscuring it. This means maintaining strict white space between the two circular grids. If the charts bleed into one another, you lose the ability to see the individual geometry clearly. I prefer a clean, modular approach where the eye can move from Chart A to Chart B without feeling a sense of visual vertigo. It’s about creating a stable platform for your own observations.
Visualizing Comparative Data Without Overstepping the Bounds of Truth
When I sit down at my desk with two different birth charts, the temptation is to immediately start weaving a story about “destiny” or “soulmates.” It is a seductive trap. When you are visualizing comparative data, there is a tendency to let the eye leap across the white space between the two circles, inventing connections that aren’t actually there. I’ve learned through years of checking ephemerides that just because two planets occupy the same degree in different charts doesn’t mean they are “talking” to one another in a meaningful way. You have to be careful not to let the visual proximity trick you into a sense of cosmic inevitability.
The real work lies in maintaining a strict discipline of analytical distance. If you are using specific side-by-side chart layout techniques, you must ensure that the scale and orientation of both charts are identical. If one chart is zoomed in on the lunar nodes and the other is a wide-angle view of the entire ecliptic, you are no longer comparing data; you are creating an optical illusion. I always tell my readers: look at the math first, look at the geometry second, and only then, if the numbers actually support it, allow yourself to wonder about the meaning.
The Limit of the Overlay
I’ve learned that placing two charts side by side isn’t about finding a way to make them agree; it’s about seeing exactly where they refuse to. If you try to force a single narrative over two different lives, you aren’t reading astrology anymore—you’re just writing fiction.
Rosalind Teague
The Final Alignment
We have covered a great deal of ground, moving from the technical necessity of dual-axis frameworks to the ethical responsibility of avoiding forced narratives. By mastering the mechanics of alignment and respecting the structural integrity of your dashboard, you ensure that the data remains the star of the show, rather than your own desire to find a pattern where none exists. Remember that placing two charts side by side is not about creating a seamless tapestry; it is about maintaining the distinction between two individual mathematical realities while allowing them to occupy the same visual field. When you prioritize precision over projection, you build a foundation that can actually withstand scrutiny.
At the end of the day, these charts are just maps—complex, beautiful, and strictly limited by the coordinates we provide. Whether you are comparing the planetary aspects of a partnership or tracking the transit cycles of a single life, the goal is never to find a predestined script written in the heavens. Instead, the goal is to use these visual tools to see the raw architecture of possibility more clearly. I have spent years looking at these configurations, and I have learned that the most profound insights don’t come from the math itself, but from what you choose to do once the numbers are laid bare before you.